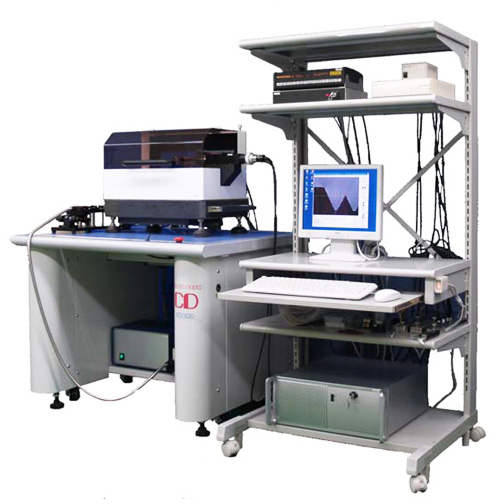
V-groove board, fiber array inspection machine
(YGN-590-FAVG)
This system uses image processing techniques and a laser heterodyne to measure multi-core optical connectors, the waveguide pitch deviation and shape with a high precision. It also takes the measurements at an optimal magnification using a special optical system.
| Measurement subject |
|
|---|---|
| Repeat measurement precision | 3σ≦0.1μm |
| Measurement time | 1 – 2 sec/1 core, 1 groove |
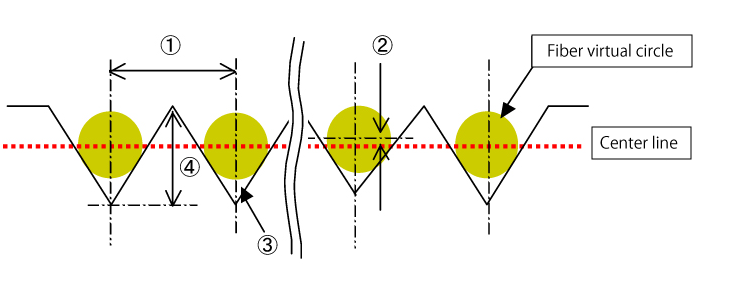
- Measure the pitch between V-grooves.
- Measure the deviation in the Y-axis direction (up and down direction) from the center of the fiber virtual circle.
- Measure the angle of the V-groove.
- Measure the height of the V-groove.
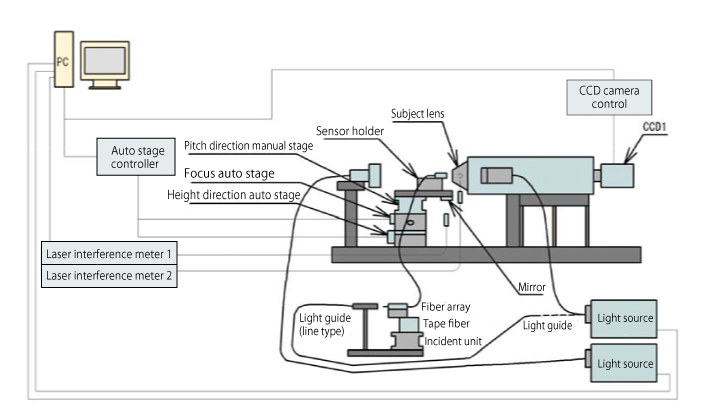
System configuration
| Microscope | Infinite optical system subject lens
|
|---|---|
| CCD | 2456 × 2058 (pixels) |
| Light source system 1 (co-axial reflection light) | LED light external control |
| Light source system 1 (co-axial reflection light) | LED light external control |
| Auto X,Y,Z stage |
|
| Laser interference (2-axis) |
|
| Tape fiber incident unit | Custom-made |
| Work holder | Custom-made |
| PC | OS:Windows7 |
| Auto stage controller | X, Y, Z-axis stage control |
Options
- Vibration isolation table (auto-levelling system, continuous air supply system)
- Calibration glass pattern gauge
Product details
This product is a system to take dimensional measurements at a high accuracy by improving the reproducibility of images taken with a special optical system and high resolution camera using a unique image processing algorithm, by mounting a laser interference meter to measure the movement to raise the reliability of the values, and by controlling the XYZ auto stage and light intensity using a PC, with standard values being set for the inspection.
The measurement subjects of this system are the V-groove boards and fiber arrays of optical communication parts. These optical communication parts are manufactured with a high degree of precision in order to keep the connection loss at a minimum and maintain a high density with the same shape. As one of the few systems available in the world to take such stringent measurements, the systems that we have delivered are rated highly by manufacturers of optical communication parts both in Japan and overseas.
An explanation of the system outline and measurement details for each measurement subject is given below.
Description of measurement details
Dimensional measurements of the V-groove board are taken to measure the pitch between the V-grooves, the deviation in the up and down direction of the V-groove, the angle of the V-groove, and the height of the V-groove.
The pitch between the V-grooves can be measured using in 2 ways. The first method measures the distance in the horizontal direction of the adjacent V-groove from the intersection point of the two oblique sides based on the V-groove oblique sides while the second method measures the distance in the horizontal direction of the adjacent V-groove from the center of a fiber virtual circle drawn the V-groove oblique sides.
The deviation in the up and down direction of the V-groove is measured using the center of the fiber virtual circle drawn in the V-groove in 2 ways. The first method measures the displaced distance in the vertical direction using the straight line linking the centers at both ends as a reference (in this case, the measurement subject becomes a V-groove except at the two ends) while the second method creates a virtual reference from the displacement in the up and down direction of all the V-grooves and then measures the displaced distance in the up and down direction of the V-groove relative to the virtual reference.
The angle of the V-groove is determined from the two oblique sides of the V-groove while the height is the vertical distance from the intersection point of the two oblique sides to the top of the oblique sides.
Dimensional measurements of the fiber array are taken to measure the distance in the horizontal direction between the fiber cores, the distance in the vertical direction of the fiber cores, and the distance between the fiber cores. These measurements are derived based on the centers of the approximate circles of the fiber core centers.
The deviation in the horizontal direction between the fiber cores determines the distance in the horizontal direction of the adjacent fiber core.
The distance in the vertical direction of the fiber core can be measured in 2 ways. The first method measures the displaced distance in the vertical direction of the fiber core except at the two ends using the straight line linking the ends of the first and last fiber core as a reference while the second method creates a virtual reference from the displacement in the up and down direction of all the fiber cores and then measures the displaced distance in the up and down direction of the fiber core relative to the virtual reference.
The distance between the fiber cores is derived from the above-mentioned pitch (X position data) and deviation in the up and down direction (Y position data).
Description of system
This product is broadly composed of the main unit and the control unit. The main unit is composed of the stand, measurement unit, XYZ auto stage/work mounting unit and observation light unit while the control unit is made up of the PC, PC rack, driver box and laser interference meter, with the system constructed on a host PC.
An outline of the main unit is explained in sequence below. The stand maintains a stable posture with the damping and auto leveling functions of the continuous air supply system, and the unit is operated with the measurement unit placed on the mounting surface.
The measurement unit uses a stone surface plate as the base to support stable measurements by enhancing the rigidity and attenuating the vibration.The XYZ auto stage, resolution 0.01 μm laser interference meter, microscope and transmission light unit are mounted on the base, and infiltration from the top during auto operation is prevented by using a cover to cover the measurement unit.
The movement of each axis on the XYZ auto stage is X-axis 100 mm, Y-axis 4 mm, Z-axis 4 mm for the standard specifications. The movement can also be customized.The drive unit uses a motor attached with an encoder to raise the correlation between the drive and movement.Each stage has an independent structure and is loaded in the ZYX sequence. 2 mirrors used for the laser interference meter are installed in the top-most X-axis to detect the movement, up and down displacement during movement, and Z-axis movement.In addition, a work holder is mounted on top of the X-axis to securely fasten the measurement subject and special parts customized for each customer so as to improve the measurement accuracy.
As the observation light unit takes the core images to be subject to the image processing, the microscope, lighting devices and CCD camera used all come from leading Japanese manufacturers in order to ensure high quality and reliability.The image sensor of the CCD camera reduces the noise in the CCD sensor and the sensor individual loss while the pixel count raises the reproducibility of the image process by employing a high resolution QSXGA CCD to capture the image vividly.LEDs are employed as the light source for the lighting devices to obtain a stable output. Besides being easier to start up on a daily basis, compared to lighting devices using electric bulbs, the maintenance cost (replacement of worn-out fan) and running cost (life and consumption power of light bulbs) are also lower.In addition, transmission lights are selected strictly for each measurement subject to significantly reduce the unevenness in the luminance on the screen.
The PC serves as a host for the control unit to control all the image processing, drive, auto focus, laser interference meter and light intensity using a variety of boards required in the original software and control.OS is Windows 7 (Japanese or English).
Multi-value processing is carried to detect a subject using a unique algorithm in the image processing. When likened to the processing data volume, if the guide holes of the MT connector are the detection subjects, the approximate circles are derived from the data volume of more than 20,000 pixels from 4 or more columns for the detection of the subject at an ambient pixel count of 5,000 pixels, and subject detection is carried out at a high speed for a processing time below the decimal point.
In order to improve the reliability of the values derived through image processing, besides reproducibility, calibration is also essential.As the XY distance on the image is also included in the derivation process in the system, the necessity for this is seriously considered by producing a specially-ordered reference pattern and performing calibration in the respective XY directions using the pattern for each measurement subject at each magnification (field of vision).The reference pattern defines the traceability system drawing and the list of inspection results.
Auto focus is one of the functions in the original software which is used to align the point to the respective focus point with good reproducibility using the reflected light and transmitted light in the focus scanning and contrast detection system. Light intensity control is also one of the functions of the original software which is used for level adjustment and turning the lights on and off. If the detected luminance is higher or lower than the luminance set, the auto light function uses the light source as a loop control to adjust the luminance to the level set.